
The Atal Setu Effect: How MTHL Is Repricing Alibaug Real Estate
Executive Summary
This Mumbai Trans Harbour Link Alibaug briefing examines the Atal Setu crossing’s impact on Alibaug property prices: the Atal Setu crossing has already cut effective travel time between Mumbai and Alibaug to roughly 1–1.5 hours, down from a historical 3-plus hours by road and ferry. Alibaug land values have already moved from ₹2,884 per sq ft in 2018 to ₹7,210 per sq ft in 2025, and Liases Foras projects a further 3x–3.5x rise in land values and a 2x–2.5x rise in premium villa prices over the next 5–6 years. This briefing sets out what has already changed, what the traffic data actually shows one year in, and what the next infrastructure leg, the proposed Revas-Karanja Bridge, would add on top of it.
Why Mumbai Trans Harbour Link Is Alibaug’s Single Biggest Price Catalyst
Alibaug’s investment case has always rested on one constraint: access. A coastline within roughly 100 kilometers (about 62 miles) of India’s financial capital was structurally undervalued for decades because getting there reliably took the better part of a day. The Mumbai Trans Harbour Link, commissioned as Atal Setu in January 2024, is the first piece of infrastructure to directly remove that constraint rather than merely improve it.
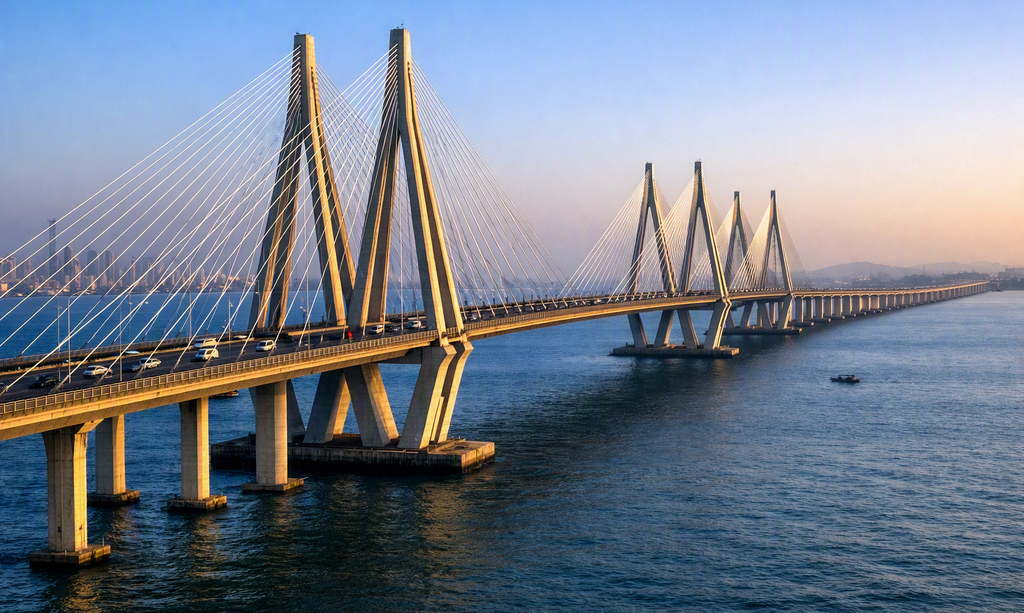
At close to 22 kilometers, combining roughly 16.5 kilometers of sea bridge with 5.5 kilometers of land viaduct (about 13.7 miles of sea span and 3.4 miles of viaduct), it is India’s longest sea bridge and the direct link between Sewri in South Mumbai and Chirle, near Nhava Sheva in Navi Mumbai. It was built at a cost of roughly ₹17,843 crore. The link does not reach Alibaug directly, but it collapses the Mumbai-to-Navi-Mumbai leg that used to anchor the slowest part of the journey.
Most coastal markets near a major metro reprice gradually, as incremental road widening or a new highway interchange chips away at travel time over several years. Alibaug’s repricing is unusual because it is tied to a single, discrete event: a bridge that either exists or does not, opened on a specific date, with published before-and-after traffic and toll data. That is a cleaner signal than the vague “improving connectivity” language that dominates most regional real estate coverage.
That is the mechanism behind the Liases Foras figures: this is not a generic “Alibaug is trending” story, it is a specific, dated, infrastructure-linked repricing event with a before-and-after data trail.
Mumbai Trans Harbour Link Alibaug Impact: The Data
The table below sets out the core metrics behind the current Alibaug investment thesis, drawn from the Liases Foras report published in May 2026 alongside MTHL’s own published project and traffic data.
| Metric | 2018 / Baseline | 2025 / Current | 2031 Projection |
|---|---|---|---|
| Alibaug Land Value (₹/sq ft) | ₹2,884 | ₹7,210 | ≈ ₹21,250 (projected) |
| Mumbai–Alibaug Travel Time | 3+ hours (pre-MTHL) | 1–1.5 hours (via Atal Setu) | 1–1.5 hours (holding, per current traffic data) |
| Annual Tourist Footfall (Alibaug region) | 2.2 million (2020) | 4.5 million (2025) | Not projected in source |
| Atal Setu Average Daily Traffic | — (pre-opening) | 22,689 vehicles/day (Year 1 actual) | 70,000 vehicles/day (design capacity, unreached) |
| Premium Managed Villa Rental Yield | — | ≈ 12% (60–80% occupancy) | Not projected in source |
Traffic Reality vs. Projections
Atal Setu’s published one-year performance data is worth reading directly rather than through developer marketing. Average daily traffic settled at roughly 22,689 vehicles, meaningfully below the original 57,525-vehicle-per-day projection for 2021 and well under the bridge’s 70,000-vehicle daily design capacity. That gap is not a red flag for the Alibaug thesis; it means the bridge currently has significant unused capacity to absorb further weekend and leisure traffic growth without congestion eroding the travel-time gain.
The toll structure also matters to the investment case, since it sets the recurring cost of second-home use. A car pays ₹250 one-way or ₹375 for a same-day return as of the current 2026 tariff, with eligible electric vehicles receiving a full toll exemption under Maharashtra’s 2025 EV policy. For a family making the trip most weekends, that toll is a rounding error against the value of the time saved.
Reading the Micro-Market Gradient
Liases Foras splits Alibaug into four micro-markets rather than treating it as one price zone, and the gradient matters more than the headline average. North Alibaug, closest to the mainland crossing points, commands the highest values, followed by Central and South Alibaug. East Alibaug is flagged explicitly as the early-stage land-banking zone, where prices have not yet repriced to reflect the connectivity change — buyers evaluating raw plots there should start with our guide to NA land conversion in Raigad district, since zoning status determines whether that land-banking thesis is even buildable.
That gradient is the practical takeaway for a buyer reading this briefing: the MTHL-driven repricing has already happened in North Alibaug, partially happened in Central and South, and has not yet happened in the East. Demand data supports the timing argument. Tourist footfall to the region nearly doubled from 2.2 million visitors in 2020 to 4.5 million in 2025, and weekend floating population in villages like Nagaon now runs to roughly 50,000 against a local resident base under 10,000.
That demand is already showing up in yield, not just price. Liases Foras puts premium managed villa occupancy at 60 to 80 percent, with 4-5 BHK managed villas generating rental yields around 12 percent, a figure that stands out against most Indian residential rental yields, which typically run in the low single digits.
What This Means for a Buyer’s Timing Decision
A buyer reading the micro-market gradient correctly should treat North Alibaug less as an opportunity and more as a benchmark: it shows what full repricing against this connectivity event looks like once the market has finished absorbing it. Central and South Alibaug are mid-repricing, which is a different risk profile than either a fully priced-in North Alibaug asset or a still-speculative East Alibaug land parcel. Matching a buyer’s holding period to that repricing stage matters more than chasing the headline growth number in isolation.
A buyer with a 5-to-6-year horizon, matching the Liases Foras projection window, is underwriting the same repricing thesis that already played out in North Alibaug, just earlier in its cycle. A buyer looking for near-term liquidity or a shorter hold should weight North and Central Alibaug’s already-demonstrated yield performance more heavily than East Alibaug’s larger but less certain upside.

What’s Next: The Revas-Karanja Bridge
The current MTHL-driven repricing is, on Liases Foras’s own framing, only the first leg of a two-stage infrastructure story. The proposed Revas-Karanja Bridge, still in planning rather than under active construction, would connect Navi Mumbai more directly into the Alibaug side of the bay. It is projected to cut the Navi Mumbai-to-Alibaug leg from roughly 2 hours to about 30 minutes.
That second bridge sits inside a wider ₹66,600 crore program of planned and ongoing regional infrastructure investment tied to this corridor. If the pattern from Atal Setu holds, which is measurable price and yield repricing following a real, opened piece of infrastructure rather than an announced one, the Revas-Karanja Bridge represents the second and larger repricing event still ahead of the market rather than behind it.
The QREST View
The Atal Setu case is unusual for Indian infrastructure-linked real estate because the before-and-after data is now genuinely available, not projected. Travel time has measurably fallen, traffic has a full year of real usage data attached to it, and land values have a seven-year price trail running through the exact period the bridge was built and opened. That combination is what separates this from the generic “Alibaug is the next big thing” content already crowding this keyword.
The strategic read for QREST’s readership, consistent with our broader view on private estates as an alternative asset class, is that the market is currently pricing in the first bridge and has not yet fully priced in the second. That gap, between a completed, data-verified infrastructure event and a still-proposed one, is where the more interesting risk-adjusted opportunity in this micro-market currently sits, concentrated most clearly in Central, South, and East Alibaug rather than the already-repriced North.
This briefing is an analytical reference for QREST’s readership, built on the Liases Foras report published in May 2026 and MTHL’s own published traffic and toll data. It is not investment advice or a solicitation, and the 2031 figures cited are third-party projections, not guaranteed outcomes; any buyer should independently verify current pricing and infrastructure timelines before committing capital.
Pingback: Alibaug Infrastructure Boom 2026: Investor Guide
Pingback: Private Estates Alternative Asset Class